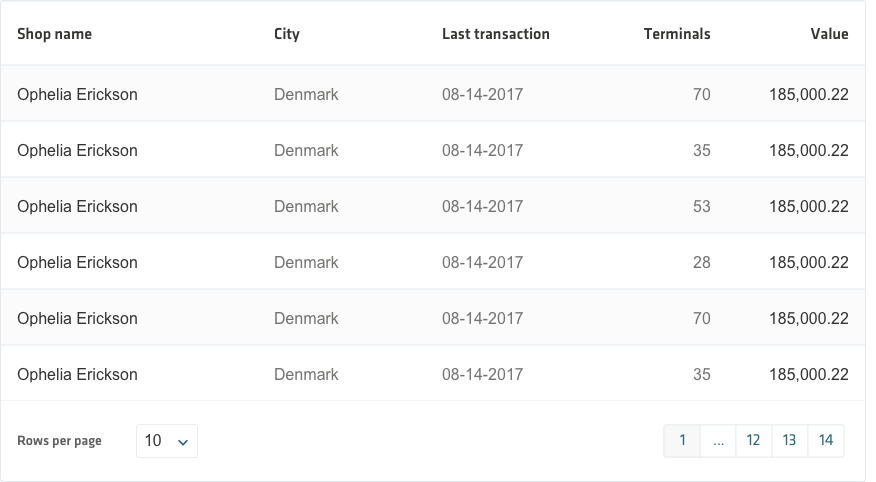
Data tables are used to display sets of data, along with navigation and editing tools. A lot of the digital products made here in Nets feature data tables, and quite often they find themselves as being the most important item of the page they are featured on. As such, it is our duty to ensure that any tables we design are made with the upmost care for readability, clarity and attention to detail.
Data Tables
Guidelines
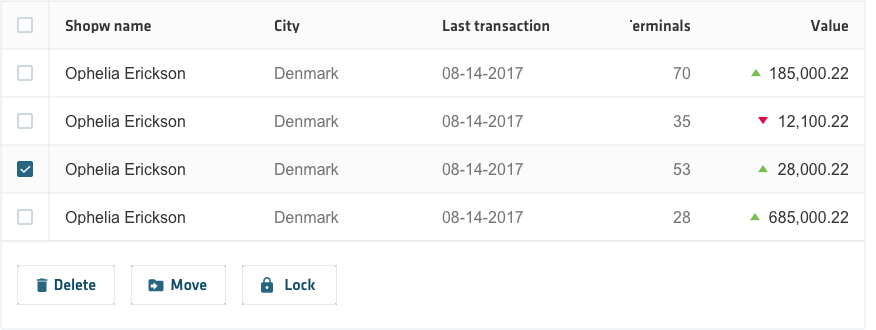
In its default layout, a table contains a header row at the top that lists column names along with rows of data. The table can also contain checkboxes at the start of each row for mass manipulation of table data and tools of data manipulation, positioned either at the end of each row or globally, at the bottom of the table. Here are some guidelines to help design your tables for the best legibility.
Left-align text
In the spirit of maxing readability, text within a table cell should be aligned the same as you would align text anywhere else - to the left. Never center or justify the text in your tables.
Right-align data
Numbers should be right-aligned to help aid scanning and making comparisons of magnitude. Ideally, you should have the same number of decimal places for this to function. If this is not the case and you are dealing with irregular length numeric data, you can align numbers to the decimal point. This helps your reader scan among a wider variety of data.
Don’t over-stylise
Avoid using excessive table styles, such as text formatting, borders, background fills and other manners of ornament. While used sparingly they help speed the scanning of your table, however overuse will produce quite the opposite, especially when dealing with a large table of complex data.

Striped rows, taller rows
Depending on data type and complexity, you can use striped rows as a method of easing the readability of a table. Also, you can increase row height in order to better separate rows of data.

Sorting columns
You can enable sorting columns by adding icons to each column header and changing the default text color of the header row to Midnight Blue, as a signifier of interaction. By default, the table will be sorted by the most important value. If a user clicks on a column that is already sorted, the sort order will be reversed and the icon will signify this by changing the highlighted arrow.

Data manipulation - checkboxes
Tables can allow data manipulation through the addition of checkboxes at the start of each row and action buttons at the bottom of the table. The buttons apply the action on the rows selected using the checkboxes.

Data manipulation - Inline
Data manipulation can also be enabled through inline buttons on each row. When clicking or tapping the button, the action will be performed on the corresponding row.
